News
Medtronic reports third quarter fiscal 2024 financial results

Delivers on commitments with strong growth in Core Spine, Cardiac Surgery, Structural Heart, Cardiac Pacing, and across many international markets; Diabetes increases double digits as U.S. business returns to growth; Raises full year guidance
DUBLIN, Feb. 20, 2024 /PRNewswire/ — Medtronic plc (NYSE:MDT) today announced financial results for its third quarter (Q3) of fiscal year 2024 (FY24), which ended January 26, 2024.
Key Highlights
- Revenue of $8.1 billion increased 4.7% as reported and 4.6% organic
- GAAP diluted earnings per share (EPS) of $0.99; non-GAAP diluted EPS of $1.30
- Raises FY24 organic revenue growth and EPS guidance
- Company provides portfolio management update on Patient Monitoring and Respiratory Interventions businesses
- Received U.S. FDA approval for PulseSelect™ pulsed field ablation (PFA) system and Percept™ RC neurostimulator with BrainSense™ technology; CE Mark for MiniMed™ 780G System with Simplera Sync™ CGM and Micra™ AV2 and Micra™ VR2 leadless pacemakers
Financial Results
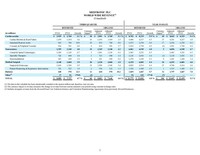
Medtronic reported Q3 worldwide revenue of $8.089 billion, an increase of 4.7% as reported and 4.6% on an organic basis. The company’s organic revenue results reflect continued momentum across the company, driven by strong growth in Diabetes, Core Spine, Cardiac Surgery, Structural Heart, and Cardiac Pacing, as well as strength in international markets. The organic revenue growth comparison excludes:
- Revenue of $17 million and the associated $2 million unfavorable impact from foreign currency translation reported as Other, stemming from business separations; and
- The favorable impact from foreign currency translation of $70 million on the remaining segments.
As reported, Q3 GAAP net income and diluted EPS were $1.322 billion and $0.99, respectively, both representing increases of 8%. As detailed in the financial schedules included at the end of this release, Q3 non-GAAP net income of $1.728 billion and non-GAAP diluted EPS of $1.30 were both flat. Included in non-GAAP diluted EPS was an 11 cent, or 8%, unfavorable impact from foreign currency translation.
“We’re building momentum, with another quarter of solid execution on our commitments. We continue to deliver durable revenue growth, with particular strength in multiple businesses, as well as in international markets as we expand access to our innovative healthcare technologies around the globe,” said Geoff Martha, Medtronic chairman and chief executive officer. “Our recent major product approvals – including transformative products in the diabetes, cardiac rhythm management, neuromodulation, hypertension, and pulsed field ablation spaces – increase our confidence in driving reliable growth over the coming quarters and years.”
Cardiovascular Portfolio
The Cardiovascular Portfolio includes the Cardiac Rhythm & Heart Failure (CRHF), Structural Heart & Aortic (SHA), and Coronary & Peripheral Vascular (CPV) divisions. Revenue of $2.929 billion increased 6.1% as reported and 5.1% organic, with a low-double digit organic increase in SHA, mid-single digit organic increases in CPV, and low-single digit increase in CRHF.
- CRHF results included low-single digit growth in Cardiac Rhythm Management, driven by high-single digit growth in Cardiac Pacing Therapies, including mid-teens growth in Micra™ transcatheter pacing systems; Cardiac Ablation Solutions grew low-double digits in international markets
- SHA driven by low-double digit growth in both Aortic and Cardiac Surgery; Structural Heart grew high-single digits, with double digit growth in Western Europe and Japan on the adoption of Evolut™ FX
- CPV delivered high-single digit growth in Coronary on growth in guide catheters, balloons, and drug-eluting stents; Peripheral Vascular Health grew mid-single digits, with low-double digit growth in Vascular Embolization products, high-single digit growth in drug-coated balloons
- Received U.S. FDA approval and CE Mark for PulseSelect™ pulsed field ablation (PFA) system, with first commercial cases occurring in fiscal Q4, and the Nitron CryoConsole™ system; Received CE Mark for Micra™ AV2 and Micra™ VR2 next generation leadless pacemakers
Neuroscience Portfolio
The Neuroscience Portfolio includes the Cranial & Spinal Technologies (CST), Specialty Therapies, and Neuromodulation divisions. Revenue of $2.355 billion increased 4.8% as reported and 4.3% organic, with a mid-single digit organic increase in CST, low-single digit organic increases in Specialty Therapies and flat organic results in Neuromodulation.
- CST overall performance was driven by continued adoption of the company’s AiBLE™ ecosystem, with high-single digit global and U.S. growth in Core Spine, mid-teens global and U.S. growth in Biologics, and mid-single digit growth in Neurosurgery
- Specialty Therapies results driven by mid-single digit growth in Neurovascular, including double digit growth in flow diversion; ENT grew mid-single digits with strength in power capital and disposables and localized drug delivery sinus implants; Pelvic Health results driven by mid-single digit growth in sacral neuromodulation on the continued adoption of the InterStim X™ system, offset by a product line divestiture
- Neuromodulation results included low-single digit growth in Brain Modulation, with mid-teens Western Europe growth on launch of the Percept™ RC neurostimulator with BrainSense™ technology; Pain Stim results were flat, with low-single digit growth in the U.S.
Medical Surgical Portfolio
The Medical Surgical Portfolio includes the Surgical & Endoscopy (SE) and the Patient Monitoring & Respiratory Interventions (PMRI) divisions. Revenue of $2.148 billion increased 3.9% as reported and 2.9% organic, with low-single digit organic increases in both SE and PMRI. Excluding sales of ventilators, which declined mid-twenties, both Medical Surgical and PMRI grew mid-single digits organic.
- SE results included mid-single digit growth in General Surgical Technologies, with strength in wound management and hernia products, low-single digit growth in Advanced Surgical Technologies, and mid-single growth in Endoscopy
- PMRI results driven by mid-single digit growth in Patient Monitoring, with high twenties growth in Nellcor™ pulse oximetry monitors; Respiratory Interventions results declined mid-single digit, with low-single digit growth in Airways offset by declines in ventilator sales
Diabetes
Diabetes revenue of $640 million increased 12.3% as reported and 10.2% organic.
- U.S. grew mid-single digits, returning to growth on the continued launch of the MiniMed™ 780G system; High-forties growth in U.S. insulin pump sales with continued sequential increases in customer base
- Non-U.S. Developed Markets grew low-double digits on continued MiniMed™ 780G system adoption and increased CGM attachment rates
- Received CE Mark for MiniMed™ 780G System with Simplera Sync™ CGM; limited European release expected in spring 2024 with phased European commercial launch in summer 2024
Patient Monitoring and Respiratory Interventions (PMRI) Update
Medtronic has decided to exit its ventilator product line and retain and combine the remaining PMRI businesses into one business unit called Acute Care and Monitoring (ACM). Exiting the increasingly unprofitable ventilator product line and combining the remaining businesses allows for increased investment in ACM with a focus on profitable growth. Given this increased investment along with an improved competitive landscape, the company has strong conviction in driving durable category leadership in this newly combined business. Medtronic will continue to honor existing ventilator contracts to serve the needs of its customers and their patients, and expects that existing manufacturers, who today account for the majority of the market, can meet customer demand for new ventilators moving forward.
Guidance
The company today raised its FY24 revenue growth and EPS guidance.
The company increased its FY24 organic revenue growth guidance from the prior 4.75% to the new range of 4.75% to 5%. The organic revenue growth guidance excludes the impact of foreign currency and revenue related to business separations reported as Other. Including Other revenue and the impact of foreign currency, if recent foreign currency exchange rates hold, FY24 revenue growth on a reported basis would be in the range of 2.9% to 3.3%.
The company increased its FY24 diluted non-GAAP EPS guidance from the prior range of $5.13 to $5.19 to the new range of $5.19 to $5.21, a 4 cent increase at the midpoint that is reflective of the company’s third quarter outperformance.
“In addition to delivering durable sales growth, we also drove improvements to our margins, as our cost efficiency programs helped to offset the impact of inflation, tax, and currency, contributing to our EPS and cash flow performance in the quarter,” said Karen Parkhill, Medtronic EVP & chief financial officer. “Based on our year-to-date performance, including another solid financial performance this quarter, we are raising our full-year guidance on both the top and bottom lines. We remain focused on restoring our earnings power and creating value for our shareholders.”
Video Webcast Information
Medtronic will host a video webcast today, February 20, at 8:00 a.m. EST (7:00 a.m. CST) to provide information about its businesses for the public, investors, analysts, and news media. This webcast can be accessed by clicking on the Events icon at investorrelations.medtronic.com, and this earnings release will be archived at news.medtronic.com. Within 24 hours of the webcast, a replay of the webcast and transcript of the company’s prepared remarks will be available by clicking on the Events icon at investorrelations.medtronic.com.
Medtronic plans to report its FY24 fourth quarter results on Thursday, May 23, 2024. For fiscal year 2025, Medtronic plans to report its first, second, third, and fourth quarter results on Tuesday, August 20, 2024, November 19, 2024, February 18, 2025, and Thursday, May 22, 2025, respectively. Confirmation and additional details will be provided closer to the specific event.
Financial Schedules and Earnings Presentation
The third quarter financial schedules and non-GAAP reconciliations can be viewed by clicking on the Investor Events link at investorrelations.medtronic.com. To view a printable PDF of the financial schedules and non-GAAP reconciliations, click here. To view the third quarter earnings presentation, click here.
|
MEDTRONIC PLC
WORLD WIDE REVENUE(1)
(Unaudited)
|
||||||||||||||||||||||||||||
|
THIRD QUARTER
|
YEAR-TO-DATE
|
|||||||||||||||||||||||||||
|
REPORTED
|
ORGANIC
|
REPORTED
|
ORGANIC
|
|||||||||||||||||||||||||
|
(in millions)
|
FY24
|
FY23
|
Growth
|
Currency
|
Adjusted
|
Adjusted
|
Growth
|
FY24
|
FY23
|
Growth
|
Currency
|
Adjusted
|
Adjusted
|
Growth
|
||||||||||||||
|
Cardiovascular
|
$ 2,929
|
$ 2,760
|
6.1 %
|
$ 28
|
$ 2,901
|
$ 2,760
|
5.1 %
|
$ 8,702
|
$ 8,219
|
5.9 %
|
$ 40
|
$ 8,662
|
$ 8,219
|
5.4 %
|
||||||||||||||
|
Cardiac Rhythm & Heart Failure
|
1,470
|
1,419
|
3.6
|
16
|
1,454
|
1,419
|
2.5
|
4,408
|
4,217
|
4.5
|
27
|
4,381
|
4,217
|
3.9
|
||||||||||||||
|
Structural Heart & Aortic
|
843
|
760
|
10.9
|
10
|
833
|
760
|
9.6
|
2,475
|
2,259
|
9.6
|
17
|
2,458
|
2,259
|
8.8
|
||||||||||||||
|
Coronary & Peripheral Vascular
|
616
|
581
|
6.0
|
2
|
614
|
581
|
5.7
|
1,818
|
1,744
|
4.2
|
(3)
|
1,821
|
1,744
|
4.4
|
||||||||||||||
|
Neuroscience
|
2,355
|
2,248
|
4.8
|
10
|
2,345
|
2,248
|
4.3
|
6,861
|
6,549
|
4.8
|
5
|
6,856
|
6,549
|
4.7
|
||||||||||||||
|
Cranial & Spinal Technologies
|
1,204
|
1,128
|
6.7
|
3
|
1,201
|
1,128
|
6.5
|
3,465
|
3,253
|
6.5
|
—
|
3,465
|
3,253
|
6.5
|
||||||||||||||
|
Specialty Therapies
|
726
|
699
|
3.9
|
3
|
723
|
699
|
3.4
|
2,126
|
2,052
|
3.6
|
(3)
|
2,129
|
2,052
|
3.8
|
||||||||||||||
|
Neuromodulation
|
425
|
420
|
1.2
|
4
|
421
|
420
|
0.2
|
1,270
|
1,244
|
2.1
|
9
|
1,261
|
1,244
|
1.4
|
||||||||||||||
|
Medical Surgical
|
2,148
|
2,068
|
3.9
|
20
|
2,128
|
2,068
|
2.9
|
6,329
|
6,003
|
5.4
|
36
|
6,293
|
6,003
|
4.8
|
||||||||||||||
|
Surgical & Endoscopy
|
1,616
|
1,546
|
4.5
|
18
|
1,598
|
1,546
|
3.4
|
4,803
|
4,514
|
6.4
|
35
|
4,768
|
4,514
|
5.6
|
||||||||||||||
|
Patient Monitoring & Respiratory Interventions
|
532
|
522
|
1.9
|
2
|
530
|
522
|
1.5
|
1,526
|
1,489
|
2.5
|
1
|
1,525
|
1,489
|
2.4
|
||||||||||||||
|
Diabetes
|
640
|
570
|
12.3
|
12
|
628
|
570
|
10.2
|
1,829
|
1,667
|
9.7
|
32
|
1,797
|
1,667
|
7.8
|
||||||||||||||
|
Other(3)
|
17
|
81
|
(79.0)
|
(2)
|
—
|
—
|
—
|
54
|
243
|
(77.8)
|
(7)
|
—
|
—
|
—
|
||||||||||||||
|
TOTAL
|
$ 8,089
|
$ 7,727
|
4.7 %
|
$ 68
|
$ 8,001
|
$ 7,646
|
4.6 %
|
$ 23,775
|
$ 22,682
|
4.8 %
|
$ 106
|
$ 23,607
|
$ 22,439
|
5.2 %
|
||||||||||||||
|
(1)
|
The data in this schedule has been intentionally rounded to the nearest million and, therefore, may not sum.
|
|
(2)
|
The currency impact to revenue measures the change in revenue between current and prior year periods using constant exchange rates.
|
|
(3)
|
Includes inorganic revenue from the divested Renal Care Solutions business and Transition Manufacturing Agreements from previously divested businesses.
|
|
MEDTRONIC PLC
U.S.(1)(2) REVENUE
(Unaudited)
|
||||||||||||||||||||||||
|
THIRD QUARTER
|
YEAR-TO-DATE
|
|||||||||||||||||||||||
|
REPORTED
|
ORGANIC
|
REPORTED
|
ORGANIC
|
|||||||||||||||||||||
|
(in millions)
|
FY24
|
FY23
|
Growth
|
Adjusted
|
Adjusted
|
Growth
|
FY24
|
FY23
|
Growth
|
Adjusted
|
Adjusted
|
Growth
|
||||||||||||
|
Cardiovascular
|
$ 1,373
|
$ 1,363
|
0.7 %
|
$ 1,373
|
$ 1,363
|
0.7 %
|
$ 4,149
|
$ 4,059
|
2.2 %
|
$ 4,149
|
$ 4,059
|
2.2 %
|
||||||||||||
|
Cardiac Rhythm & Heart Failure
|
745
|
753
|
(1.1)
|
745
|
753
|
(1.1)
|
2,247
|
2,233
|
0.6
|
2,247
|
2,233
|
0.6
|
||||||||||||
|
Structural Heart & Aortic
|
363
|
337
|
7.7
|
363
|
337
|
7.7
|
1,087
|
997
|
9.0
|
1,087
|
997
|
9.0
|
||||||||||||
|
Coronary & Peripheral Vascular
|
265
|
274
|
(3.3)
|
265
|
274
|
(3.3)
|
816
|
829
|
(1.6)
|
816
|
829
|
(1.6)
|
||||||||||||
|
Neuroscience
|
1,556
|
1,507
|
3.3
|
1,556
|
1,507
|
3.3
|
4,614
|
4,437
|
4.0
|
4,614
|
4,437
|
4.0
|
||||||||||||
|
Cranial & Spinal Technologies
|
875
|
824
|
6.2
|
875
|
824
|
6.2
|
2,560
|
2,404
|
6.5
|
2,560
|
2,404
|
6.5
|
||||||||||||
|
Specialty Therapies
|
407
|
402
|
1.2
|
407
|
402
|
1.2
|
1,202
|
1,186
|
1.3
|
1,202
|
1,186
|
1.3
|
||||||||||||
|
Neuromodulation
|
275
|
281
|
(2.1)
|
275
|
281
|
(2.1)
|
852
|
848
|
0.5
|
852
|
848
|
0.5
|
||||||||||||
|
Medical Surgical
|
960
|
959
|
0.1
|
960
|
959
|
0.1
|
2,805
|
2,685
|
4.5
|
2,805
|
2,685
|
4.5
|
||||||||||||
|
Surgical & Endoscopy
|
663
|
674
|
(1.6)
|
663
|
674
|
(1.6)
|
1,971
|
1,888
|
4.4
|
1,971
|
1,888
|
4.4
|
||||||||||||
|
Patient Monitoring & Respiratory Interventions
|
297
|
285
|
4.2
|
297
|
285
|
4.2
|
834
|
797
|
4.6
|
834
|
797
|
4.6
|
||||||||||||
|
Diabetes
|
224
|
215
|
4.2
|
224
|
215
|
4.2
|
629
|
650
|
(3.2)
|
629
|
650
|
(3.2)
|
||||||||||||
|
Other(3)
|
7
|
17
|
(58.8)
|
—
|
—
|
—
|
23
|
66
|
(65.2)
|
—
|
—
|
—
|
||||||||||||
|
TOTAL
|
$ 4,120
|
$ 4,062
|
1.4 %
|
$ 4,113
|
$ 4,045
|
1.7 %
|
$ 12,219
|
$ 11,897
|
2.7 %
|
$ 12,197
|
$ 11,831
|
3.1 %
|
||||||||||||
|
(1)
|
U.S. includes the United States and U.S. territories.
|
|
(2)
|
The data in this schedule has been intentionally rounded to the nearest million and, therefore, may not sum.
|
|
(3)
|
Includes inorganic revenue from the divested Renal Care Solutions business and Transition Manufacturing Agreements from previously divested businesses.
|
|
MEDTRONIC PLC
WORLD WIDE REVENUE: GEOGRAPHIC (1)(2)
(Unaudited)
|
||||||||||||||||||||||||||||
|
THIRD QUARTER
|
YEAR-TO-DATE
|
|||||||||||||||||||||||||||
|
REPORTED
|
ORGANIC
|
REPORTED
|
ORGANIC
|
|||||||||||||||||||||||||
|
(in millions)
|
FY24
|
FY23
|
Growth
|
Currency
|
Adjusted
|
Adjusted
|
Growth
|
FY24
|
FY23
|
Growth
|
Currency
|
Adjusted
|
Adjusted
|
Growth
|
||||||||||||||
|
U.S.
|
$ 1,373
|
$ 1,363
|
0.7 %
|
$ —
|
$ 1,373
|
$ 1,363
|
0.7 %
|
$ 4,149
|
$ 4,059
|
2.2 %
|
$ —
|
$ 4,149
|
$ 4,059
|
2.2 %
|
||||||||||||||
|
Non-U.S. Developed
|
950
|
859
|
10.6
|
30
|
920
|
859
|
7.1
|
2,818
|
2,553
|
10.4
|
75
|
2,743
|
2,553
|
7.4
|
||||||||||||||
|
Emerging Markets
|
607
|
538
|
12.8
|
(2)
|
609
|
538
|
13.2
|
1,734
|
1,607
|
7.9
|
(34)
|
1,768
|
1,607
|
10.0
|
||||||||||||||
|
Cardiovascular
|
2,929
|
2,760
|
6.1
|
28
|
2,901
|
2,760
|
5.1
|
8,702
|
8,219
|
5.9
|
40
|
8,662
|
8,219
|
5.4
|
||||||||||||||
|
U.S.
|
1,556
|
1,507
|
3.3
|
—
|
1,556
|
1,507
|
3.3
|
4,614
|
4,437
|
4.0
|
—
|
4,614
|
4,437
|
4.0
|
||||||||||||||
|
Non-U.S. Developed
|
442
|
401
|
10.2
|
10
|
432
|
401
|
7.7
|
1,257
|
1,189
|
5.7
|
20
|
1,237
|
1,189
|
4.0
|
||||||||||||||
|
Emerging Markets
|
357
|
341
|
4.7
|
—
|
357
|
341
|
4.7
|
991
|
923
|
7.4
|
(15)
|
1,006
|
923
|
9.0
|
||||||||||||||
|
Neuroscience
|
2,355
|
2,248
|
4.8
|
10
|
2,345
|
2,248
|
4.3
|
6,861
|
6,549
|
4.8
|
5
|
6,856
|
6,549
|
4.7
|
||||||||||||||
|
U.S.
|
960
|
959
|
0.1
|
—
|
960
|
959
|
0.1
|
2,805
|
2,685
|
4.5
|
—
|
2,805
|
2,685
|
4.5
|
||||||||||||||
|
Non-U.S. Developed
|
758
|
725
|
4.6
|
15
|
743
|
725
|
2.5
|
2,270
|
2,144
|
5.9
|
36
|
2,234
|
2,144
|
4.2
|
||||||||||||||
|
Emerging Markets
|
429
|
384
|
11.7
|
5
|
424
|
384
|
10.4
|
1,254
|
1,174
|
6.8
|
—
|
1,254
|
1,174
|
6.8
|
||||||||||||||
|
Medical Surgical
|
2,148
|
2,068
|
3.9
|
20
|
2,128
|
2,068
|
2.9
|
6,329
|
6,003
|
5.4
|
36
|
6,293
|
6,003
|
4.8
|
||||||||||||||
|
U.S.
|
224
|
215
|
4.2
|
—
|
224
|
215
|
4.2
|
629
|
650
|
(3.2)
|
—
|
629
|
650
|
(3.2)
|
||||||||||||||
|
Non-U.S. Developed
|
322
|
274
|
17.5
|
13
|
309
|
274
|
12.8
|
947
|
792
|
19.6
|
36
|
911
|
792
|
15.0
|
||||||||||||||
|
Emerging Markets
|
94
|
80
|
17.5
|
(1)
|
95
|
80
|
18.8
|
253
|
226
|
11.9
|
(4)
|
257
|
226
|
13.7
|
||||||||||||||
|
Diabetes
|
640
|
570
|
12.3
|
12
|
628
|
570
|
10.2
|
1,829
|
1,667
|
9.7
|
32
|
1,797
|
1,667
|
7.8
|
||||||||||||||
|
U.S.
|
7
|
17
|
(58.8)
|
—
|
—
|
—
|
—
|
23
|
66
|
(65.2)
|
—
|
—
|
—
|
—
|
||||||||||||||
|
Non-U.S. Developed
|
2
|
36
|
(94.4)
|
(1)
|
—
|
—
|
—
|
14
|
101
|
(86.1)
|
(4)
|
—
|
—
|
—
|
||||||||||||||
|
Emerging Markets
|
8
|
28
|
(71.4)
|
(1)
|
—
|
—
|
—
|
18
|
76
|
(76.3)
|
(3)
|
—
|
—
|
—
|
||||||||||||||
|
Other(4)
|
17
|
81
|
(79.0)
|
(2)
|
—
|
—
|
—
|
54
|
243
|
(77.8)
|
(7)
|
—
|
—
|
—
|
||||||||||||||
|
U.S.
|
4,120
|
4,062
|
1.4
|
—
|
4,113
|
4,045
|
1.7
|
12,219
|
11,897
|
2.7
|
—
|
12,197
|
11,831
|
3.1
|
||||||||||||||
|
Non-U.S. Developed
|
2,473
|
2,294
|
7.8
|
67
|
2,403
|
2,258
|
6.4
|
7,305
|
6,779
|
7.8
|
162
|
7,125
|
6,678
|
6.7
|
||||||||||||||
|
Emerging Markets
|
1,495
|
1,371
|
9.0
|
2
|
1,484
|
1,343
|
10.5
|
4,251
|
4,006
|
6.1
|
(56)
|
4,285
|
3,929
|
9.1
|
||||||||||||||
|
TOTAL
|
$ 8,089
|
$ 7,727
|
4.7 %
|
$ 68
|
$ 8,001
|
$ 7,646
|
4.6 %
|
$ 23,775
|
$ 22,682
|
4.8 %
|
$ 106
|
$ 23,607
|
$ 22,439
|
5.2 %
|
||||||||||||||
|
(1)
|
U.S. includes the United States and U.S. territories. Non-U.S. developed markets include Japan, Australia, New Zealand, Korea, Canada, and the countries within Western Europe. Emerging Markets include the countries of the Middle East, Africa, Latin America, Eastern Europe, and the countries of Asia that are not included in the non-U.S. developed markets, as previously defined.
|
|
(2)
|
The data in this schedule has been intentionally rounded to the nearest million and, therefore, may not sum.
|
|
(3)
|
The currency impact to revenue measures the change in revenue between current and prior year periods using constant exchange rates.
|
|
(4)
|
Includes inorganic revenue from the divested Renal Care Solutions business and Transition Manufacturing Agreements from previously divested businesses.
|
|
MEDTRONIC PLC
CONSOLIDATED STATEMENTS OF INCOME
(Unaudited)
|
|||||||
|
Three months ended
|
Nine months ended
|
||||||
|
(in millions, except per share data)
|
January 26,
|
January 27,
|
January 26,
|
January 27,
|
|||
|
Net sales
|
$ 8,089
|
$ 7,727
|
$ 23,775
|
$ 22,682
|
|||
|
Costs and expenses:
|
|||||||
|
Cost of products sold, excluding amortization of intangible assets
|
2,782
|
2,689
|
8,172
|
7,740
|
|||
|
Research and development expense
|
695
|
688
|
2,060
|
2,055
|
|||
|
Selling, general, and administrative expense
|
2,673
|
2,615
|
7,971
|
7,799
|
|||
|
Amortization of intangible assets
|
419
|
431
|
1,274
|
1,275
|
|||
|
Restructuring charges, net
|
20
|
38
|
114
|
81
|
|||
|
Certain litigation charges
|
—
|
—
|
105
|
—
|
|||
|
Other operating expense (income), net
|
17
|
(125)
|
(13)
|
(187)
|
|||
|
Operating profit
|
1,483
|
1,392
|
4,091
|
3,920
|
|||
|
Other non-operating income, net
|
(177)
|
(149)
|
(407)
|
(342)
|
|||
|
Interest expense, net
|
188
|
167
|
517
|
449
|
|||
|
Income before income taxes
|
1,472
|
1,375
|
3,982
|
3,813
|
|||
|
Income tax provision
|
135
|
146
|
936
|
1,218
|
|||
|
Net income
|
1,337
|
1,229
|
3,045
|
2,595
|
|||
|
Net income attributable to noncontrolling interests
|
(15)
|
(6)
|
(23)
|
(17)
|
|||
|
Net income attributable to Medtronic
|
$ 1,322
|
$ 1,222
|
$ 3,022
|
$ 2,579
|
|||
|
Basic earnings per share
|
$ 0.99
|
$ 0.92
|
$ 2.27
|
$ 1.94
|
|||
|
Diluted earnings per share
|
$ 0.99
|
$ 0.92
|
$ 2.27
|
$ 1.94
|
|||
|
Basic weighted average shares outstanding
|
1,329.7
|
1,330.2
|
1,330.1
|
1,329.6
|
|||
|
Diluted weighted average shares outstanding
|
1,331.7
|
1,332.0
|
1,332.4
|
1,332.8
|
|||
|
The data in the schedule above has been intentionally rounded to the nearest million, and therefore, the quarterly amounts may not sum to the fiscal year-to-date amounts.
|
|
MEDTRONIC PLC
GAAP TO NON-GAAP RECONCILIATIONS(1)
(Unaudited)
|
|||||||||||||||||
|
Three months ended January 26, 2024
|
|||||||||||||||||
|
(in millions, except per share data)
|
Net Sales
|
Cost of
|
Gross
|
Operating
|
Operating
|
Income
|
Net Income
|
Diluted
|
Effective
|
||||||||
|
GAAP
|
$ 8,089
|
$ 2,782
|
65.6 %
|
$ 1,483
|
18.3 %
|
$ 1,472
|
$ 1,322
|
$ 0.99
|
9.2 %
|
||||||||
|
Non-GAAP Adjustments:
|
|||||||||||||||||
|
Amortization of intangible assets
|
—
|
—
|
—
|
419
|
5.2
|
419
|
354
|
0.27
|
15.5
|
||||||||
|
Restructuring and associated costs (2)
|
—
|
(12)
|
0.1
|
55
|
0.7
|
55
|
46
|
0.03
|
16.4
|
||||||||
|
Acquisition and divestiture-related items (3)
|
—
|
(12)
|
0.1
|
58
|
0.7
|
58
|
52
|
0.04
|
10.3
|
||||||||
|
(Gain)/loss on minority investments (4)
|
—
|
—
|
—
|
—
|
—
|
24
|
24
|
0.02
|
—
|
||||||||
|
Medical device regulations (5)
|
—
|
(18)
|
0.2
|
26
|
0.3
|
26
|
21
|
0.02
|
19.2
|
||||||||
|
Certain tax adjustments, net (6)
|
—
|
—
|
—
|
—
|
—
|
—
|
(92)
|
(0.07)
|
—
|
||||||||
|
Non-GAAP
|
$ 8,089
|
$ 2,740
|
66.1 %
|
$ 2,042
|
25.2 %
|
$ 2,055
|
$ 1,728
|
$ 1.30
|
15.2 %
|
||||||||
|
Currency impact
|
(68)
|
(66)
|
0.6
|
164
|
2.3
|
0.11
|
|||||||||||
|
Currency Adjusted
|
$ 8,021
|
$ 2,674
|
66.7 %
|
$ 2,206
|
27.5 %
|
$ 1.41
|
|||||||||||
|
Three months ended January 27, 2023
|
|||||||||||||||||
|
(in millions, except per share data)
|
Net Sales
|
Cost of
|
Gross
|
Operating
|
Operating
|
Income
|
Net Income
|
Diluted
|
Effective
|
||||||||
|
GAAP
|
$ 7,727
|
$ 2,689
|
65.2 %
|
$ 1,392
|
18.0 %
|
$ 1,375
|
$ 1,222
|
$ 0.92
|
10.6 %
|
||||||||
|
Non-GAAP Adjustments:
|
|||||||||||||||||
|
Amortization of intangible assets
|
—
|
—
|
—
|
431
|
5.6
|
431
|
367
|
0.28
|
15.1
|
||||||||
|
Restructuring and associated costs (2)
|
—
|
(26)
|
0.3
|
104
|
1.3
|
104
|
83
|
0.06
|
20.2
|
||||||||
|
Acquisition and divestiture-related items (3)
|
—
|
(9)
|
0.1
|
34
|
0.4
|
34
|
29
|
0.03
|
26.7
|
||||||||
|
(Gain)/loss on minority investments (4)
|
—
|
—
|
—
|
—
|
—
|
(8)
|
(8)
|
(0.01)
|
—
|
||||||||
|
Medical device regulations (5)
|
—
|
(23)
|
0.3
|
37
|
0.5
|
37
|
31
|
0.02
|
18.9
|
||||||||
|
Certain tax adjustments, net
|
—
|
—
|
—
|
—
|
—
|
—
|
3
|
—
|
—
|
||||||||
|
Non-GAAP
|
$ 7,727
|
$ 2,630
|
66.0 %
|
$ 1,998
|
25.9 %
|
$ 1,973
|
$ 1,727
|
$ 1.30
|
12.1 %
|
||||||||
|
See description of non-GAAP financial measures contained in the press release dated February 20, 2024.
|
|
|
(1)
|
The data in this schedule has been intentionally rounded to the nearest million or $0.01 for EPS figures, and, therefore, may not sum.
|
|
(2)
|
Associated costs include costs incurred as a direct result of the restructuring program, such as salaries for employees supporting the program, consulting expenses, and asset write-offs.
|
|
(3)
|
The charges primarily include business combination costs, changes in fair value of contingent consideration, and charges related to the potential separation of the Patient Monitoring and Respiratory Interventions businesses within our Medical Surgical Portfolio.
|
|
(4)
|
We exclude unrealized and realized gains and losses on our minority investments as we do not believe that these components of income or expense have a direct correlation to our ongoing or future business operations.
|
|
(5)
|
The charges represent incremental costs of complying with the new European Union (E.U.) medical device regulations for previously registered products and primarily include charges for contractors supporting the project and other direct third-party expenses. We consider these costs to be duplicative of previously incurred costs and/or one-time costs, which are limited to a specific time period.
|
|
(6)
|
The net tax benefit primarily relates to a change in a Swiss Cantonal tax rate associated with previously established deferred tax assets from intercompany intellectual property transactions and the step up in tax basis for Swiss Cantonal purposes.
|
|
MEDTRONIC PLC
GAAP TO NON-GAAP RECONCILIATIONS(1)
(Unaudited)
|
|||||||||||||||||
|
Nine months ended January 26, 2024
|
|||||||||||||||||
|
(in millions, except per share data)
|
Net Sales
|
Cost of
|
Gross
|
Operating
|
Operating
|
Income
|
Net Income
|
Diluted
|
Effective
|
||||||||
|
GAAP
|
$ 23,775
|
$ 8,172
|
65.6 %
|
$ 4,091
|
17.2 %
|
$ 3,982
|
$ 3,022
|
$ 2.27
|
23.5 %
|
||||||||
|
Non-GAAP Adjustments:
|
|||||||||||||||||
|
Amortization of intangible assets
|
—
|
—
|
—
|
1,274
|
5.4
|
1,274
|
1,078
|
0.81
|
15.4
|
||||||||
|
Restructuring and associated costs (2)
|
—
|
(43)
|
0.2
|
237
|
1.0
|
237
|
198
|
0.15
|
16.5
|
||||||||
|
Acquisition and divestiture-related items (3)
|
—
|
(24)
|
0.1
|
165
|
0.7
|
165
|
149
|
0.11
|
9.7
|
||||||||
|
Certain litigation charges
|
—
|
—
|
—
|
105
|
0.4
|
105
|
81
|
0.06
|
22.9
|
||||||||
|
(Gain)/loss on minority investments (4)
|
—
|
—
|
—
|
—
|
—
|
113
|
109
|
0.08
|
4.4
|
||||||||
|
Medical device regulations (5)
|
—
|
(60)
|
0.3
|
88
|
0.4
|
88
|
70
|
0.05
|
20.5
|
||||||||
|
Certain tax adjustments, net (6)
|
—
|
—
|
—
|
—
|
—
|
—
|
282
|
0.21
|
—
|
||||||||
|
Non-GAAP
|
$ 23,775
|
$ 8,046
|
66.2 %
|
$ 5,961
|
25.1 %
|
$ 5,965
|
$ 4,988
|
$ 3.74
|
16.0 %
|
||||||||
|
Currency impact
|
(106)
|
(132)
|
0.4
|
406
|
1.8
|
0.27
|
|||||||||||
|
Currency Adjusted
|
$ 23,669
|
$ 7,914
|
66.6 %
|
$ 6,367
|
26.9 %
|
$ 4.01
|
|||||||||||
|
Nine months ended January 27, 2023
|
|||||||||||||||||
|
(in millions, except per share data)
|
Net Sales
|
Cost of
|
Gross
|
Operating
|
Operating
|
Income
|
Net Income
|
Diluted
|
Effective
|
||||||||
|
GAAP
|
$ 22,682
|
$ 7,740
|
65.9 %
|
$ 3,920
|
17.3 %
|
$ 3,813
|
$ 2,579
|
$ 1.94
|
31.9 %
|
||||||||
|
Non-GAAP Adjustments:
|
|||||||||||||||||
|
Amortization of intangible assets
|
—
|
—
|
—
|
1,275
|
5.6
|
1,275
|
1,082
|
0.81
|
15.2
|
||||||||
|
Restructuring and associated costs (2)
|
—
|
(67)
|
0.3
|
275
|
1.2
|
275
|
219
|
0.16
|
20.0
|
||||||||
|
Acquisition and divestiture-related items (3)
|
—
|
(59)
|
0.3
|
207
|
0.9
|
207
|
186
|
0.14
|
32.3
|
||||||||
|
(Gain)/loss on minority investments (4)
|
—
|
—
|
—
|
—
|
—
|
(23)
|
(23)
|
(0.02)
|
—
|
||||||||
|
Medical device regulations (5)
|
—
|
(62)
|
0.3
|
107
|
0.5
|
107
|
87
|
0.07
|
18.7
|
||||||||
|
Debt redemption premium and other charges (7)
|
—
|
—
|
—
|
—
|
—
|
53
|
42
|
0.03
|
20.8
|
||||||||
|
Certain tax adjustments, net (8)
|
—
|
—
|
—
|
—
|
—
|
—
|
783
|
0.59
|
—
|
||||||||
|
Non-GAAP
|
$ 22,682
|
$ 7,551
|
66.7 %
|
$ 5,783
|
25.5 %
|
$ 5,706
|
$ 4,953
|
$ 3.72
|
12.9 %
|
||||||||
|
See description of non-GAAP financial measures contained in the press release dated February 20, 2024.
|
|
|
(1)
|
The data in this schedule has been intentionally rounded to the nearest million or $0.01 for EPS figures, and, therefore, may not sum.
|
|
(2)
|
Associated costs include costs incurred as a direct result of the restructuring program, such as salaries for employees supporting the program, consulting expenses, and asset write-offs.
|
|
(3)
|
The charges primarily include business combination costs, changes in fair value of contingent consideration, and charges related to the potential separation of the Patient Monitoring and Respiratory Interventions businesses within our Medical Surgical Portfolio.
|
|
(4)
|
We exclude unrealized and realized gains and losses on our minority investments as we do not believe that these components of income or expense have a direct correlation to our ongoing or future business operations.
|
|
(5)
|
The charges represent incremental costs of complying with the new European Union medical device regulations for previously registered products and primarily include charges for contractors supporting the project and other direct third-party expenses. We consider these costs to be duplicative of previously incurred costs and/or one-time costs, which are limited to a specific period.
|
|
(6)
|
The net charge primarily relates to an income tax reserve adjustment associated with the June 1, 2023, Israeli Central-Lod District Court decision and the establishment of a valuation allowance against certain net operating losses which were partially offset by a benefit from the change in a Swiss Cantonal tax rate associated with previously established deferred tax assets from intercompany intellectual property transactions and the step up in tax basis for Swiss Cantonal purposes.
|
|
(7)
|
The charges relate to the early redemption of approximately $2.3 billion of debt and were recorded within interest expense, net within the consolidated statements of income.
|
|
(8)
|
The charge primarily relates to a $764 million reserve adjustment that was a direct result of the U.S. Tax Court opinion, issued on August 18, 2022, on the previously disclosed litigation regarding the allocation of income between Medtronic, Inc. and its wholly owned subsidiary operating in Puerto Rico.
|
|
MEDTRONIC PLC
GAAP TO NON-GAAP RECONCILIATIONS(1)
(Unaudited)
|
|||||||||||||||
|
Three months ended January 26, 2024
|
|||||||||||||||
|
(in millions)
|
Net Sales
|
SG&A
|
SG&A
|
R&D
|
R&D
|
Other
|
Other
|
Other Non-
|
|||||||
|
GAAP
|
$ 8,089
|
$ 2,673
|
33.0 %
|
$ 695
|
8.6 %
|
$ 17
|
0.2 %
|
$ (177)
|
|||||||
|
Non-GAAP Adjustments:
|
|||||||||||||||
|
Restructuring and associated costs (2)
|
—
|
(23)
|
(0.3)
|
—
|
—
|
—
|
—
|
—
|
|||||||
|
Acquisition and divestiture-related items (3)
|
—
|
(24)
|
(0.3)
|
—
|
—
|
(23)
|
(0.3)
|
—
|
|||||||
|
Medical device regulations (4)
|
—
|
—
|
—
|
(8)
|
(0.1)
|
—
|
—
|
—
|
|||||||
|
(Gain)/loss on minority investments (5)
|
—
|
—
|
—
|
—
|
—
|
—
|
—
|
(24)
|
|||||||
|
Non-GAAP
|
$ 8,089
|
$ 2,625
|
32.5 %
|
$ 687
|
8.5 %
|
$ (6)
|
(0.1) %
|
$ (201)
|
|||||||
|
Currency impact
|
(68)
|
(25)
|
(0.1)
|
—
|
0.1
|
(142)
|
(1.7)
|
2
|
|||||||
|
Currency Adjusted
|
$ 8,021
|
$ 2,600
|
32.4 %
|
$ 687
|
8.6 %
|
$ (148)
|
(1.8) %
|
$ (199)
|
|||||||
|
Nine months ended January 26, 2024
|
|||||||||||||||
|
(in millions)
|
Net Sales
|
SG&A
|
SG&A
|
R&D
|
R&D
|
Other
|
Other
|
Other Non-
|
|||||||
|
GAAP
|
$ 23,775
|
$ 7,971
|
33.5 %
|
$ 2,060
|
8.7 %
|
$ (13)
|
(0.1) %
|
$ (407)
|
|||||||
|
Non-GAAP Adjustments:
|
|||||||||||||||
|
Restructuring and associated costs (2)
|
—
|
(80)
|
(0.3)
|
—
|
—
|
—
|
—
|
—
|
|||||||
|
Acquisition and divestiture-related items (3)
|
—
|
(66)
|
(0.3)
|
—
|
—
|
(76)
|
(0.3)
|
—
|
|||||||
|
Medical device regulations (4)
|
—
|
(1)
|
—
|
(27)
|
(0.1)
|
—
|
—
|
—
|
|||||||
|
(Gain)/loss on minority investments (5)
|
—
|
—
|
—
|
—
|
—
|
—
|
—
|
(113)
|
|||||||
|
Non-GAAP
|
$ 23,775
|
$ 7,824
|
32.9 %
|
$ 2,033
|
8.6 %
|
$ (89)
|
(0.4) %
|
$ (520)
|
|||||||
|
Currency impact
|
(106)
|
(56)
|
(0.1)
|
2
|
—
|
(327)
|
(1.4)
|
8
|
|||||||
|
Currency Adjusted
|
$ 23,669
|
$ 7,768
|
32.8 %
|
$ 2,035
|
8.6 %
|
$ (416)
|
(1.8) %
|
$ (512)
|
|||||||
|
See description of non-GAAP financial measures contained in the press release dated February 20, 2024.
|
|
|
(1)
|
The data in this schedule has been intentionally rounded to the nearest million, and, therefore, may not sum.
|
|
(2)
|
Associated costs include costs incurred as a direct result of the restructuring program, such as salaries for employees supporting the program, consulting expenses, and asset write-offs.
|
|
(3)
|
The charges primarily include business combination costs, changes in fair value of contingent consideration, and charges related to the potential separation of the Patient Monitoring and Respiratory Interventions businesses within our Medical Surgical Portfolio.
|
|
(4)
|
The charges represent incremental costs of complying with the new European Union medical device regulations for previously registered products and primarily include charges for contractors supporting the project and other direct third-party expenses. We consider these costs to be duplicative of previously incurred costs and/or one-time costs, which are limited to a specific time period.
|
|
(5)
|
We exclude unrealized and realized gains and losses on our minority investments as we do not believe that these components of income or expense have a direct correlation to our ongoing or future business operations.
|
|
MEDTRONIC PLC
GAAP TO NON-GAAP RECONCILIATIONS(1)
(Unaudited)
|
|||
|
Nine months ended
|
|||
|
(in millions)
|
January 26, 2024
|
January 27, 2023
|
|
|
Net cash provided by operating activities
|
$ 4,010
|
$ 3,579
|
|
|
Additions to property, plant, and equipment
|
(1,161)
|
(1,081)
|
|
|
Free Cash Flow(2)
|
$ 2,849
|
$ 2,498
|
|
|
See description of non-GAAP financial measures contained in the press release dated February 20, 2024.
|
|
|
(1)
|
The data in this schedule has been intentionally rounded to the nearest million, and, therefore, may not sum.
|
|
(2)
|
Free cash flow represents operating cash flows less property, plant, and equipment additions.
|
|
MEDTRONIC PLC
CONSOLIDATED BALANCE SHEETS
(Unaudited)
|
||||
|
(in millions)
|
January 26, 2024
|
April 28, 2023
|
||
|
ASSETS
|
||||
|
Current assets:
|
||||
|
Cash and cash equivalents
|
$ 1,623
|
$ 1,543
|
||
|
Investments
|
6,698
|
6,416
|
||
|
Accounts receivable, less allowances and credit losses of $180 and $176, respectively
|
5,968
|
5,998
|
||
|
Inventories, net
|
5,726
|
5,293
|
||
|
Other current assets
|
2,499
|
2,425
|
||
|
Total current assets
|
22,513
|
21,675
|
||
|
Property, plant, and equipment, net
|
5,838
|
5,569
|
||
|
Goodwill
|
41,160
|
41,425
|
||
|
Other intangible assets, net
|
13,690
|
14,844
|
||
|
Tax assets
|
3,599
|
3,477
|
||
|
Other assets
|
4,036
|
3,959
|
||
|
Total assets
|
$ 90,836
|
$ 90,948
|
||
|
LIABILITIES AND EQUITY
|
||||
|
Current liabilities:
|
||||
|
Current debt obligations
|
$ 1,029
|
$ 20
|
||
|
Accounts payable
|
1,992
|
2,662
|
||
|
Accrued compensation
|
2,174
|
1,949
|
||
|
Accrued income taxes
|
1,109
|
840
|
||
|
Other accrued expenses
|
3,488
|
3,581
|
||
|
Total current liabilities
|
9,793
|
9,051
|
||
|
Long-term debt
|
24,153
|
24,344
|
||
|
Accrued compensation and retirement benefits
|
1,049
|
1,093
|
||
|
Accrued income taxes
|
1,821
|
2,360
|
||
|
Deferred tax liabilities
|
615
|
708
|
||
|
Other liabilities
|
1,410
|
1,727
|
||
|
Total liabilities
|
38,840
|
39,283
|
||
|
Commitments and contingencies
|
||||
|
Shareholders’ equity:
|
||||
|
Ordinary shares— par value $0.0001, 2.6 billion shares authorized, 1,329,653,024 and
|
—
|
—
|
||
|
Additional paid-in capital
|
24,589
|
24,590
|
||
|
Retained earnings
|
30,661
|
30,392
|
||
|
Accumulated other comprehensive loss
|
(3,459)
|
(3,499)
|
||
|
Total shareholders’ equity
|
51,792
|
51,483
|
||
|
Noncontrolling interests
|
204
|
182
|
||
|
Total equity
|
51,996
|
51,665
|
||
|
Total liabilities and equity
|
$ 90,836
|
$ 90,948
|
||
|
The data in this schedule has been intentionally rounded to the nearest million, and, therefore, may not sum.
|
|
MEDTRONIC PLC
CONSOLIDATED STATEMENTS OF CASH FLOWS
(Unaudited)
|
|||
|
Nine months ended
|
|||
|
(in millions)
|
January 26, 2024
|
January 27, 2023
|
|
|
Operating Activities:
|
|||
|
Net income
|
$ 3,045
|
$ 2,595
|
|
|
Adjustments to reconcile net income to net cash provided by operating activities:
|
|||
|
Depreciation and amortization
|
1,993
|
2,018
|
|
|
Provision for credit losses
|
62
|
54
|
|
|
Deferred income taxes
|
(250)
|
(78)
|
|
|
Stock-based compensation
|
303
|
280
|
|
|
Loss on debt extinguishment
|
—
|
53
|
|
|
Other, net
|
265
|
182
|
|
|
Change in operating assets and liabilities, net of acquisitions and divestitures:
|
|||
|
Accounts receivable, net
|
(140)
|
(408)
|
|
|
Inventories, net
|
(530)
|
(936)
|
|
|
Accounts payable and accrued liabilities
|
(253)
|
163
|
|
|
Other operating assets and liabilities
|
(485)
|
(344)
|
|
|
Net cash provided by operating activities
|
4,010
|
3,579
|
|
|
Investing Activities:
|
|||
|
Acquisitions, net of cash acquired
|
(74)
|
(1,867)
|
|
|
Additions to property, plant, and equipment
|
(1,161)
|
(1,081)
|
|
|
Purchases of investments
|
(5,422)
|
(5,472)
|
|
|
Sales and maturities of investments
|
5,142
|
5,387
|
|
|
Other investing activities, net
|
(155)
|
15
|
|
|
Net cash used in investing activities
|
(1,670)
|
(3,018)
|
|
|
Financing Activities:
|
|||
|
Change in current debt obligations, net
|
1,010
|
625
|
|
|
Proceeds from short-term borrowings (maturities greater than 90 days)
|
—
|
2,284
|
|
|
Issuance of long-term debt
|
—
|
3,430
|
|
|
Payments on long-term debt
|
—
|
(3,083)
|
|
|
Dividends to shareholders
|
(2,753)
|
(2,711)
|
|
|
Issuance of ordinary shares
|
206
|
209
|
|
|
Repurchase of ordinary shares
|
(510)
|
(548)
|
|
|
Other financing activities
|
(44)
|
(276)
|
|
|
Net cash used in financing activities
|
(2,091)
|
(70)
|
|
|
Effect of exchange rate changes on cash and cash equivalents
|
(170)
|
317
|
|
|
Net change in cash and cash equivalents
|
80
|
808
|
|
|
Cash and cash equivalents at beginning of period
|
1,543
|
3,714
|
|
|
Cash and cash equivalents at end of period
|
$ 1,623
|
$ 4,521
|
|
|
Supplemental Cash Flow Information
|
|||
|
Cash paid for:
|
|||
|
Income taxes
|
$ 1,403
|
$ 1,314
|
|
|
Interest
|
568
|
262
|
|
|
The data in this schedule has been intentionally rounded to the nearest million, and, therefore, may not sum.
|
About Medtronic
Bold thinking. Bolder actions. We are Medtronic. Medtronic plc, headquartered in Dublin, Ireland, is the leading global healthcare technology company that boldly attacks the most challenging health problems facing humanity by searching out and finding solutions. Our Mission — to alleviate pain, restore health, and extend life — unites a global team of 95,000+ passionate people across 150 countries. Our technologies and therapies treat 70 health conditions and include cardiac devices, surgical robotics, insulin pumps, surgical tools, patient monitoring systems, and more. Powered by our diverse knowledge, insatiable curiosity, and desire to help all those who need it, we deliver innovative technologies that transform the lives of two people every second, every hour, every day. Expect more from us as we empower insight-driven care, experiences that put people first, and better outcomes for our world. In everything we do, we are engineering the extraordinary. For more information on Medtronic (NYSE:MDT), visit www.Medtronic.com and follow on X and LinkedIn.
FORWARD LOOKING STATEMENTS
This press release contains forward-looking statements within the meaning of the Private Securities Litigation Reform Act of 1995, which are subject to risks and uncertainties, including risks related to competitive factors, difficulties and delays inherent in the development, manufacturing, marketing and sale of medical products, government regulation, geopolitical conflicts, general economic conditions, and other risks and uncertainties described in the company’s periodic reports on file with the U.S. Securities and Exchange Commission including the most recent Annual Report on Form 10-K of the company. In some cases, you can identify these statements by forward-looking words or expressions, such as “anticipate,” “believe,” “could,” “estimate,” “expect,” “forecast,” “intend,” “looking ahead,” “may,” “plan,” “possible,” “potential,” “project,” “should,” “going to,” “will,” and similar words or expressions, the negative or plural of such words or expressions and other comparable terminology. Actual results may differ materially from anticipated results. Medtronic does not undertake to update its forward-looking statements or any of the information contained in this press release, including to reflect future events or circumstances.
NON-GAAP FINANCIAL MEASURES
This press release contains financial measures, including adjusted net income, adjusted diluted EPS, and organic revenue, which are considered “non-GAAP” financial measures under applicable SEC rules and regulations. References to quarterly or annual figures increasing, decreasing or remaining flat are in comparison to fiscal year 2023.
Medtronic management believes that non-GAAP financial measures provide information useful to investors in understanding the company’s underlying operational performance and trends and to facilitate comparisons with the performance of other companies in the med tech industry. Non-GAAP net income and diluted EPS exclude the effect of certain charges or gains that contribute to or reduce earnings but that result from transactions or events that management believes may or may not recur with similar materiality or impact to operations in future periods (Non-GAAP Adjustments). Medtronic generally uses non-GAAP financial measures to facilitate management’s review of the operational performance of the company and as a basis for strategic planning. Non-GAAP financial measures should be considered supplemental to and not a substitute for financial information prepared in accordance with U.S. generally accepted accounting principles (GAAP), and investors are cautioned that Medtronic may calculate non-GAAP financial measures in a way that is different from other companies. Management strongly encourages investors to review the company’s consolidated financial statements and publicly filed reports in their entirety. Reconciliations of the non-GAAP financial measures to the most directly comparable GAAP financial measures are included in the financial schedules accompanying this press release.
Medtronic calculates forward-looking non-GAAP financial measures based on internal forecasts that omit certain amounts that would be included in GAAP financial measures. For instance, forward-looking organic revenue growth guidance excludes the impact of foreign currency fluctuations, as well as significant acquisitions or divestitures. Forward-looking diluted non-GAAP EPS guidance also excludes other potential charges or gains that would be recorded as Non-GAAP Adjustments to earnings during the fiscal year. Medtronic does not attempt to provide reconciliations of forward-looking non-GAAP EPS guidance to projected GAAP EPS guidance because the combined impact and timing of recognition of these potential charges or gains is inherently uncertain and difficult to predict and is unavailable without unreasonable efforts. In addition, the company believes such reconciliations would imply a degree of precision and certainty that could be confusing to investors. Such items could have a substantial impact on GAAP measures of financial performance.
|
Contacts:
|
|
|
Erika Winkels
|
Ryan Weispfenning
|
|
Public Relations
|
Investor Relations
|
|
+1-763-526-8478
|
+1-763-505-4626
|
")
SOURCE Medtronic plc

RENO, Nev., August 1, 2024–(BUSINESS THREAD)–Modiv Industrial, Inc. (“Modiv” or the “Company”) (NYSE:MDV), the only public REIT focused exclusively on the acquisition of industrial real estate properties, today announced that it will release second quarter 2024 financial results for the quarter ended June 30, 2024 before the market opens on Tuesday, August 6, 2024. Management will host a conference call the same day at 7:30 a.m. Pacific Time (10:30 a.m. Eastern Time) to discuss the results.
Live conference call: 1-877-407-0789 or 1-201-689-8562 at 7:30 a.m. Pacific Time Tuesday, August 6.
Internet broadcast: To listen to the webcast, live or archived, use this link https://callme.viavid.com/viavid/?callme=true&passcode=13740174&h=true&info=company&r=true&B=6 or visit the investor relations page of the Modiv website at www.modiv.com.
About Modiv Industrial
Modiv Industrial, Inc. is an internally managed REIT focused on single-tenant net-leased industrial manufacturing real estate. The company actively acquires critical industrial manufacturing properties with long-term leases to tenants that fuel the national economy and strengthen the nation’s supply chains. For more information, visit: www.modiv.com.
View source version on businesswire.com: https://www.businesswire.com/news/home/20240731628803/en/
Contacts
Investor Inquiries:
management@modiv.com


Volta Finance Limited
Volta Finance Limited (VTA/VTAS)
Notification of transactions by directors, persons exercising managerial functions
responsibilities and people closely associated with them
NOT FOR DISCLOSURE, DISTRIBUTION OR PUBLICATION, IN WHOLE OR IN PART, IN THE UNITED STATES
*****
Guernsey, 1 August 2024
Pursuant to announcements made on 5 April 2019 and 26 June 2020 relating to changes to the payment of directors’ fees, Volta Finance Limited (the “Company” or “Volta”) purchased 3,380 no par value ordinary shares of the Company (“Ordinary Shares”) at an average price of €5.2 per share.
Each director receives 30% of his or her director’s fee for any year in the form of shares, which he or she is required to hold for a period of not less than one year from the respective date of issue.
The shares will be issued to the Directors, who for the purposes of Regulation (EU) No 596/2014 on Market Abuse (“March“) are “people who exercise managerial responsibilities” (a “PDMR“).
-
Dagmar Kershaw, Chairman and MDMR for purposes of MAR, has acquired an additional 1,040 Common Shares in the Company. Following the settlement of this transaction, Ms. Kershaw will have an interest in 12,838 Common Shares, representing 0.03% of the Company’s issued shares;
-
Stephen Le Page, a Director and a PDMR for MAR purposes, has acquired an additional 728 Ordinary Shares in the Company. Following the settlement of this transaction, Mr. Le Page will have an interest in 50,562 Ordinary Shares, representing 0.14% of the issued shares of the Company;
-
Yedau Ogoundele, Director and a PDMR for the purposes of MAR has acquired an additional 728 Ordinary Shares in the Company. Following the settlement of this transaction, Ms. Ogoundele will have an interest in 6,862 Ordinary Shares, representing 0.02% of the issued shares of the Company; and
-
Joanne Peacegood, Director and PDMR for MAR purposes has acquired an additional 884 Ordinary Shares in the Company. Following the settlement of this transaction, Ms. Peacegood will have an interest in 3,505 Ordinary Shares, representing 0.01% of the issued shares of the Company;
The notifications below, made in accordance with the requirements of the MAR, provide further details in relation to the above transactions:
|
a) Dagmar Kershaw |
b) Stephen LePage |
c) Yedau Ogoundele |
e) Joanne Pazgood |
|||
|
a. Position/status |
Director |
|||||
|
b. Initial Notification/Amendment |
Initial notification |
|||||
|
||||||
|
a name |
Volta Finance Limited |
|||||
|
b. LAW |
2138004N6QDNAZ2V3W80 |
|||||
|
a. Description of the financial instrument, type of instrument |
Ordinary actions |
|||||
|
b. Identification code |
GG00B1GHHH78 |
|||||
|
c. Nature of the transaction |
Acquisition and Allocation of Common Shares in Relation to Partial Payment of Directors’ Fees for the Quarter Ended July 31, 2024 |
|||||
|
d. Price(s) |
€5.2 per share |
|||||
|
e. Volume(s) |
Total: 3380 |
|||||
|
f. Transaction date |
August 1, 2024 |
|||||
|
g. Location of transaction |
At the Market – London |
|||||
|
The) |
B) |
w) |
It is) |
|||
|
Aggregate Volume: Price: |
Aggregate Volume: Price: |
Aggregate Volume: Price: |
Aggregate Volume: Price: |
|||
CONTACTS
For the investment manager
AXA Investment Managers Paris
Francois Touati
francois.touati@axa-im.com
+33 (0) 1 44 45 80 22
Olivier Pons
Olivier.pons@axa-im.com
+33 (0) 1 44 45 87 30
Company Secretary and Administrator
BNP Paribas SA, Guernsey branch
guernsey.bp2s.volta.cosec@bnpparibas.com
+44 (0) 1481 750 853
Corporate Broker
Cavendish Securities plc
Andre Worn Out
Daniel Balabanoff
+44 (0) 20 7397 8900
*****
ABOUT VOLTA FINANCE LIMITED
Volta Finance Limited is incorporated in Guernsey under the Companies (Guernsey) Law, 2008 (as amended) and listed on Euronext Amsterdam and the Main Market of the London Stock Exchange for listed securities. Volta’s home member state for the purposes of the EU Transparency Directive is the Netherlands. As such, Volta is subject to the regulation and supervision of the AFM, which is the regulator of the financial markets in the Netherlands.
Volta’s investment objectives are to preserve its capital throughout the credit cycle and to provide a stable income stream to its shareholders through dividends that it expects to distribute quarterly. The company currently seeks to achieve its investment objectives by seeking exposure predominantly to CLOs and similar asset classes. A more diversified investment strategy in structured finance assets may be pursued opportunistically. The company has appointed AXA Investment Managers Paris, an investment management firm with a division specializing in structured credit, to manage the investment portfolio of all of its assets.
*****
ABOUT AXA INVESTMENT MANAGERS
AXA Investment Managers (AXA IM) is a multi-specialist asset management firm within the AXA Group, a global leader in financial protection and wealth management. AXA IM is one of the largest European-based asset managers with 2,700 professionals and €844 billion in assets under management at the end of December 2023.
*****
This press release is issued by AXA Investment Managers Paris (“AXA IM”) in its capacity as alternative investment fund manager (within the meaning of Directive 2011/61/EU, the “AIFM Directive”) of Volta Finance Limited (“Volta Finance”), the portfolio of which is managed by AXA IM.
This press release is for information only and does not constitute an invitation or inducement to purchase shares of Volta Finance. Its circulation may be prohibited in certain jurisdictions and no recipient may circulate copies of this document in violation of such limitations or restrictions. This document is not an offer to sell the securities referred to herein in the United States or to persons who are “U.S. persons” for purposes of Regulation S under the U.S. Securities Act of 1933, as amended (the “Securities Act”), or otherwise in circumstances where such an offering would be restricted by applicable law. Such securities may not be sold in the United States absent registration or an exemption from registration under the Securities Act. Volta Finance does not intend to register any part of the offering of such securities in the United States or to conduct a public offering of such securities in the United States.
*****
This communication is being distributed to, and is directed only at, (i) persons who are outside the United Kingdom or (ii) investment professionals falling within Article 19(5) of the Financial Services and Markets Act 2000 (Financial Promotion) Order 2005 (the “Order”) or (iii) high net worth companies and other persons to whom it may lawfully be communicated falling within Article 49(2)(a) to (d) of the Order (all such persons together being referred to as “relevant persons”). The securities referred to herein are available only to, and any invitation, offer or agreement to subscribe for, purchase or otherwise acquire such securities will be made only to, relevant persons. Any person who is not a relevant person should not act on or rely on this document or any of its contents. Past performance should not be relied upon as a guide to future performance.
*****
This press release contains statements that are, or may be deemed to be, “forward-looking statements”. These forward-looking statements can be identified by the use of forward-looking terminology, including the words “believes”, “anticipates”, “expects”, “intends”, “is/are expected”, “may”, “will” or “should”. They include statements about the level of the dividend, the current market environment and its impact on the long-term return on Volta Finance’s investments. By their nature, forward-looking statements involve risks and uncertainties and readers are cautioned that such forward-looking statements are not guarantees of future performance. Actual results, portfolio composition and performance of Volta Finance may differ materially from the impression created by the forward-looking statements. AXA IM undertakes no obligation to publicly update or revise forward-looking statements.
Any target information is based on certain assumptions as to future events that may not materialize. Due to the uncertainty surrounding these future events, targets are not intended to be and should not be considered to be profits or earnings or any other type of forecast. There can be no assurance that any of these targets will be achieved. Furthermore, no assurance can be given that the investment objective will be achieved.
Figures provided which relate to past months or years and past performance cannot be considered as a guide to future performance or construed as a reliable indicator as to future performance. Throughout this review, the citation of specific trades or strategies is intended to illustrate some of Volta Finance’s investment methodologies and philosophies as implemented by AXA IM. The historical success or AXA IM’s belief in the future success of any such trade or strategy is not indicative of, and has no bearing on, future results.
The valuation of financial assets may vary significantly from the prices that AXA IM could obtain if it sought to liquidate the positions on Volta Finance’s behalf due to market conditions and the general economic environment. Such valuations do not constitute a fairness or similar opinion and should not be relied upon as such.
Publisher: AXA INVESTMENT MANAGERS PARIS, a company incorporated under the laws of France, with registered office at Tour Majunga, 6, Place de la Pyramide – 92800 Puteaux. AXA IMP is authorized by Autorité des Marchés Financiers under registration number GP92008 as an alternative investment fund manager within the meaning of the AIFM Directive.
*****

Litter (AAPL) is set to report its fiscal third-quarter earnings after the market closes on Thursday, and unlike the rest of its tech peers, the main story won’t be about the rise of AI.
Instead, analysts and investors will be keeping a close eye on iPhone sales in China and whether Apple has managed to stem the tide of users switching to domestic rivals including Huawei.
For the quarter, analysts expect Apple to report earnings per share (EPS) of $1.35 on revenue of $84.4 billion, according to estimates compiled by Bloomberg. Apple saw EPS of $1.26 on revenue of $81.7 billion in the same period last year.
Apple shares are up about 18.6% year to date despite a rocky start to the year, thanks in part to the impact of the company’s Worldwide Developer Conference (WWDC) in May, where showed off its Apple Intelligence software.
But the big question on investors’ minds is whether iPhone sales have risen or fallen in China. Apple has struggled with slowing phone sales in the region, with the company noting an 8% decline in sales in the second quarter as local rivals including Huawei and Xiaomi gain market share.

Apple CEO Tim Cook delivers remarks at the start of the Apple Worldwide Developers Conference (WWDC). (Photo by Justin Sullivan/Getty Images) (Justin Sullivan via Getty Images)
And while some analysts, such as JPMorgan’s Samik Chatterjee, believe sales in Greater China, which includes mainland China, Hong Kong, Singapore and Taiwan, rose in the third quarter, others, including David Vogt of UBS Global Research, say sales likely fell about 6%.
Analysts surveyed by Bloomberg say Apple will report revenue of $15.2 billion in Greater China, down 3.1% from the same quarter last year, when Apple reported revenue of $15.7 billion in China. Overall iPhone sales are expected to reach $38.9 billion, down 1.8% year over year from the $39.6 billion Apple saw in the third quarter of 2023.
But Apple is expected to make up for those declines in other areas, including Services and iPad sales. Services revenue is expected to reach $23.9 billion in the quarter, up from $21.2 billion in the third quarter of 2023, while iPad sales are expected to reach $6.6 billion, up from the $5.7 billion the segment brought in in the same period last year. Those iPad sales projections come after Apple launched its latest iPad models this year, including a new iPad Pro lineup powered by the company’s M4 chip.
Mac revenue is also expected to grow modestly in the quarter, versus a 7.3% decline last year. Sales of wearables, which include the Apple Watch and AirPods, however, are expected to decline 5.9% year over year.
In addition to Apple’s revenue numbers, analysts and investors will be listening closely for any commentary on the company’s software launches. Apple Intelligence beta for developers earlier this week.
The story continues
The software, which is powered by Apple’s generative AI technology, is expected to arrive on iPhones, iPads and Macs later this fall, though according to Bloomberg’s Marc GurmanIt won’t arrive alongside the new iPhone in September. Instead, it’s expected to arrive on Apple devices sometime in October.
Analysts are divided on the potential impact of Apple Intelligence on iPhone sales next year, with some saying the software will kick off a new iPhone sales supercycle and others offering more pessimistic expectations about the technology’s effect on Apple’s profits.
It’s important to note that Apple Intelligence is only compatible with the iPhone 15 Pro and newer phones, ensuring that all users desperate to get their hands on the tech will have to upgrade to a newer, more powerful phone as soon as it is available.
Either way, if Apple wants to make Apple Intelligence a success, it will need to ensure it has the features that will make customers excited to take advantage of the offering.

Subscribe to the Yahoo Finance Tech Newsletter. (Yahoo Finance)
Email Daniel Howley at dhowley@yahoofinance.com. Follow him on Twitter at @DanielHowley.
Read the latest financial and business news from Yahoo Finance

The number of Americans filing for unemployment benefits hit its highest level in a year last week, even as the job market remains surprisingly healthy in an era of high interest rates.
Jobless claims for the week ending July 27 rose 14,000 to 249,000 from 235,000 the previous week, the Labor Department said Thursday. It’s the highest number since the first week of August last year and the 10th straight week that claims have been above 220,000. Before that period, claims had remained below that level in all but three weeks this year.
Weekly jobless claims are widely considered representative of layoffs, and while they have been slightly higher in recent months, they remain at historically healthy levels.
Strong consumer demand and a resilient labor market helped avert a recession that many economists predicted during the Federal Reserve’s prolonged wave of rate hikes that began in March 2022.
As inflation continues to declinethe Fed’s goal of a soft landing — reducing inflation without causing a recession and mass layoffs — appears to be within reach.
On Wednesday, the Fed left your reference rate aloneBut officials have strongly suggested a cut could come in September if the data stays on its recent trajectory. And recent labor market data suggests some weakening.
The unemployment rate rose to 4.1% in June, despite the fact that American employers added 206,000 jobs. U.S. job openings also fell slightly last month. Add that to the rise in layoffs, and the Fed could be poised to cut interest rates next month, as most analysts expect.
The four-week average of claims, which smooths out some of the weekly ups and downs, rose by 2,500 to 238,000.
The total number of Americans receiving unemployment benefits in the week of July 20 jumped by 33,000 to 1.88 million. The four-week average for continuing claims rose to 1,857,000, the highest since December 2021.
Continuing claims have been rising in recent months, suggesting that some Americans receiving unemployment benefits are finding it harder to get jobs.
There have been job cuts across a range of sectors this year, from agricultural manufacturing Deerefor media such as CNNIt is in another place.

“Blackrock has just supercharged the Bitcoin and Crypto Bull race!” – Matt Hugan

Because the current Bitcoin Tori race could be the beginning of a 10 -year -old explosion – Dan Tapiero

Willy Woo – Update of the most important Tori market for each Bitcoin investor

Raoul Pal – “The banana arrives! This is the next, great phase for BTC and Crypto in 2025”

“This could be the end of Bitcoin explosive races” – Giovanni Santostasi

Absolutely massive: the next higher Bitcoin leg will shatter all expectations – Tom Lee

Volta Finance Limited – Director/PDMR Shareholding

Modiv Industrial to release Q2 2024 financial results on August 6

Apple to report third-quarter earnings as Wall Street eyes China sales

Number of Americans filing for unemployment benefits hits highest level in a year
“Blackrock has just supercharged the Bitcoin and Crypto Bull race!” – Matt Hugan
Because the current Bitcoin Tori race could be the beginning of a 10 -year -old explosion – Dan Tapiero
Willy Woo – Update of the most important Tori market for each Bitcoin investor
Raoul Pal – “The banana arrives! This is the next, great phase for BTC and Crypto in 2025”
“This could be the end of Bitcoin explosive races” – Giovanni Santostasi
-
 Videos2 weeks ago
Absolutely massive: the next higher Bitcoin leg will shatter all expectations – Tom Lee
-
News12 months ago
Volta Finance Limited – Director/PDMR Shareholding
-
 News12 months ago
Modiv Industrial to release Q2 2024 financial results on August 6
-
 News12 months ago
Apple to report third-quarter earnings as Wall Street eyes China sales
-
 News12 months ago
Number of Americans filing for unemployment benefits hits highest level in a year
-

 News1 year ago
Inventiva reports 2024 First Quarter Financial Information¹ and provides a corporate update
-

 News1 year ago
Leeds hospitals trust says finances are “critical” amid £110m deficit
-

 DeFi1 year ago
🏴☠️ Pump.Fun operated by Insider Exploit
-

 Videos1 year ago
$1,000,000 worth of BTC in 2025! Get ready for an UNPRECEDENTED PRICE EXPLOSION – Jack Mallers
-

 Videos1 year ago
ABSOLUTELY HUGE: Bitcoin is poised for unabated exponential growth – Mark Yusko and Willy Woo
-

 Markets1 year ago
Whale Investments in Bitcoin Hit $100 Billion in 2024, Fueling Insane Investor Optimism ⋆ ZyCrypto
-

 DeFi1 year ago
Active Users on Arbitrum Overtake Solana Despite ARB Token Value Drop – DL News