Markets
Bitcoin Price Surges 5%, Can BTC Bulls Regain Control?

The price of Bitcoin increased by almost 5% and exceeded $62,500. BTC is currently testing the $63,500 resistance zone with a positive angle.
- Bitcoin started a decent rise above the $62,200 and $62,400 levels.
- Price is trading above $62,500 and the 100 hourly simple moving average.
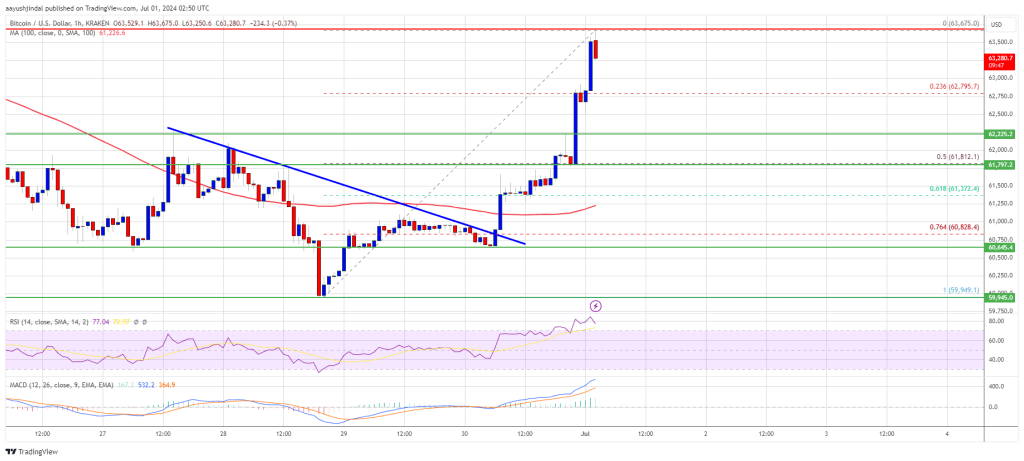
- There was a break above a major bearish trend line with resistance at $61,000 on the hourly chart of the BTC/USD pair (data feed from Kraken).
- The pair may struggle to continue above the $63,650 resistance zone.
Bitcoin Price Starts to Recover
Bitcoin price has formed a base above the $60,000 Zone. BTC remained stable and was able to start a decent increase above the $61,500 resistance zone.
There was a break above a major downtrend line with resistance at $61,000 on the hourly chart of the BTC/USD pair. The bulls were able to push the price above the $62,500 resistance. It is up almost 5% and trading near the $63,650 resistance zone.
Bitcoin price is trading above $62,500 and the 100-hour simple moving averageIt is stable and well above the 23.6% Fibonacci retracement level of the upward move from the $59,949 low to $63,675 high.
In case of further rise, the price may encounter resistance near the $63,650 level. The first key resistance lies near the $64,000 level. The next key resistance could be at $64,400. A clear move above the $64,400 resistance could trigger a steady increase and send the price higher.
In the indicated case, the price could rise and test the resistance of $65,500. Any further gains could send BTC towards the $66,000 resistance in the near term.
Are dips limited in BTC?
If Bitcoin fails to breach the $63,650 resistance zone, it could begin a downward correction. Immediate downside support lies near the $62,800 level.
The first major support is at $61,800 and the 50% Fibonacci retracement level of the upward move from the $59,949 low to $63,675 high. The next support is now forming near $61,250 and the 100 hourly simple moving average. Any further losses could send the price towards the $60,500 support zone in the near term.
Technical indicators:
Hourly MACD – The MACD is now gaining momentum in the bullish zone.
Hourly RSI (Relative Strength Index) – The RSI for BTC/USD is now above the 50 level.
Major support levels – $62,800, followed by $61,800.
Major resistance levels – $63,650 and $64,400.