Markets
What’s next for crypto?

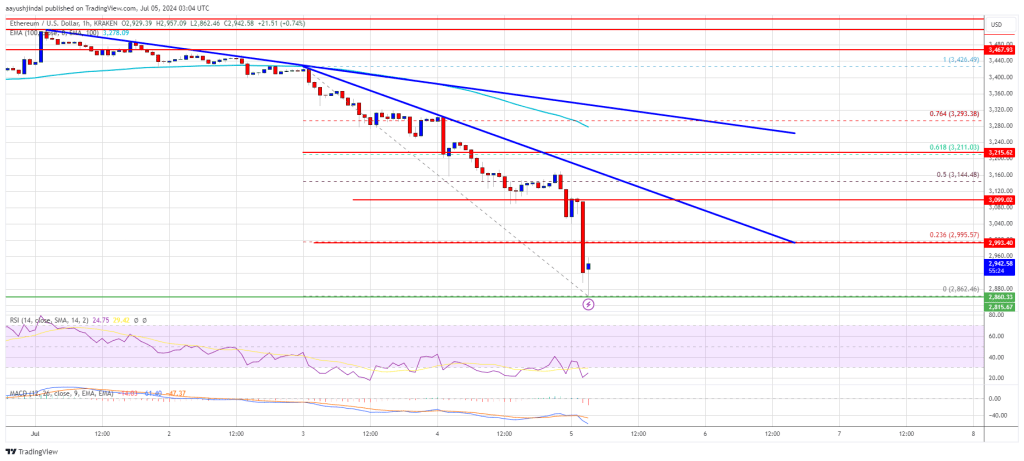
Ethereum price remained in a bearish zone below $3,250. ETH dipped below the $3,000 support and even tested the $2,850 area.
- Ethereum started a fresh decline below the $3,120 and $3,000 levels.
- Price is trading below $3,000 and the 100 hourly simple moving average.
- There is a key bearish trend line forming with resistance near $3,000 on the hourly chart of ETH/USD (data feed via Kraken).
- The pair could correct its losses, but gains could be limited above the $3,120 zone.
Ethereum price drops 8%
Ethereum price failed to start a recovery wave above the $3,150 and $3,200 resistance levels. ETH started a fresh decline below the $3,120 support zone as BitcoinThere was a move below the $3,050 and $3,000 support levels.
The price declined by 8% and even tested the $2,850 support. A low was formed at $2,862 and the price is now consolidating its losses. The price is showing many bearish signs and is trading well below the 23.6% Fibonacci retracement level of the downward move from the $3,425 high to $2,860 low.
Ethereum trades below $3,000 and the 100-hour simple moving average. In case of recovery, the price could encounter resistance near the $2,960 level. The first major resistance is near the $3,000 level.
There is also a key bearish trend line forming with resistance near $3,000 on the hourly chart of ETH/USD. The next major hurdle lies near the $3,120 level or the 50% Fibonacci retracement level of the downward move from the $3,425 high to $2,860 low.
A close above the $3,120 level could send Ether towards the $3,200 resistance. The next key resistance is near $3,250. An upside break above the $3,250 resistance could send the price higher towards the $3,350 resistance zone.
More losses for ETH?
If Ethereum fails to break the $3,000 resistance, it could continue to decline. The initial support on the downside is near $2,850. The first major support is near the $2,800 area.
A clear move below the $2,800 support could push the price towards $2,720. Any further losses could push the price towards the $2,650 level in the near term.
Technical indicators
Hourly MACD – The MACD for ETH/USD is gaining momentum in the bearish zone.
Hourly RSI – The RSI for ETH/USD is now below the 50 zone.
Major Support Level – $2,850
Major Resistance Level – $3,000